

Subscribe and receive email notifications of new blog posts.
 RSS Feed
6
Bend Oregon Housing Market Trends for September 2026
Bend Oregon Housing Market Trends for September 2026
The Bend housing market weakened in September 2026 as rising mortgage rates reduced buyer purchasing power and pushed more prospective purchasers to the sidelines. Although the median sales price remained nearly unchanged from last year, closed sales declined 16%, pending sales fell more than 21%, and the number of listings withdrawn, canceled or allowed to expire increased 65%.
Those figures tell a more complete story than the median price alone. Bend is not experiencing a flood of inventory or distressed sales, but buyers have become considerably more cautious. Homes that are not priced correctly are receiving fewer showings, undergoing substantial price reductions or leaving the market without selling.
For a broader view of current conditions, historical trends and what the numbers mean for buyers and sellers, visit our Bend Oregon Real Estate Market guide.
The statistics in this report compare September 2026 with September 2025 and include Bend single-family homes on less than one acre in ZIP codes 97701, 97702 and 97703.
September 2026 Bend Real Estate Market Snapshot
-
Median sales price: $726,250 — up 0.4%
-
Closed sales: 158 — down 16%
-
Sold price per square foot: $372 — down 1.1%
-
Original list price received: 95.2% — up 0.5%
-
Sales above list price: 12% — down 24.6%
-
Cash sales: 31% — up 6%
-
Total sold volume: $135,493,647 — down 15.9%
-
List-to-close time: 79 days — down 7.1%
-
Sales with seller concessions: 45.6% — up 14.2%
-
Average concession amount: $10,000 — up 4.7%
-
New listings: 174 — down 2.2%
-
Pending sales: 134 — down 21.2%
-
Active inventory: 518 homes — down 16%
-
Months of inventory: 3.3 months — essentially unchanged, down 0.1%
-
Unsold listings: 66 — up 65%
Bend Home Prices Appeared Stable—but Demand Weakened
The September median sales price was $726,250, only 0.4% higher than it was one year ago. At first glance, that suggests Bend home prices remained stable. However, the sold price per square foot declined 1.1% to $372. The difference between a slightly higher median price and a lower price per square foot can reflect the mix of homes sold during the month. If a greater percentage of closings involved larger or more expensive properties, the median price can rise even while underlying price pressure weakens.
Closed sales declined 16%, while total sold volume fell 15.9%. The market therefore generated nearly 16% less transaction activity and dollar volume even though the median price was nearly unchanged.
September's results do not show a broad collapse in Bend property values. They do show that high prices are becoming increasingly difficult to support when borrowing costs are also rising.
Higher Mortgage Rates Are Hurting Bend Home Sales
Mortgage rates climbed rapidly during September. According to Freddie Mac, the national average rate for a 30-year fixed mortgage increased from 6.71% on September 3 to 7.03% on September 24. It subsequently reached 7.28% during the first week of October. That movement has a direct effect on what a Bend buyer can afford. Using September's $726,250 median sales price and a 20% down payment, the buyer would finance approximately $581,000. The estimated principal-and-interest payment would be:
-
Approximately $3,753 per month at 6.71%
-
Approximately $3,877 per month at 7.03%
-
Approximately $3,975 per month at 7.28%
That is an increase of approximately $222 per month between early September and early October, without any change in the price of the home. Property taxes, homeowners insurance and association dues would be additional.
Higher rates do not merely make a home more expensive. They can prevent an otherwise qualified buyer from meeting debt-to-income requirements or force the buyer into a lower price range. This helps explain why September pending sales fell 21.2%.
Pending Sales Provide the Clearest Warning
Bend recorded 134 new pending sales in September, down 21.2% from a year earlier. This was a substantially larger decline than the 16% reduction in completed sales. Because pending contracts generally become future closings, this figure suggests continued pressure on closed sales as Bend moves further into the fall market.
New listings declined only 2.2%, while pending sales fell more than 21%. That imbalance means homes entered the market much faster than buyers placed them under contract, even though total active inventory remained below last year.
The problem is not simply the number of homes available. The larger issue is that fewer buyers can—or are willing to—purchase at current combinations of price and interest rate.
Unsold Listings Increased 65%
September had 66 unsold listings, compared with 40 in September 2025. This category includes properties that were withdrawn, canceled or expired and had not been relisted.
A 65% increase is significant. Some sellers may have decided to wait until spring. Others may have been unwilling or unable to reduce their price enough to attract a buyer. An expired or canceled listing does not necessarily indicate financial distress, but it does show that the market did not accept the property under the price, condition and terms offered.
This creates two distinct groups of sellers:
-
Those who need to sell and are reducing prices or offering concessions
-
Those who do not need to sell and are withdrawing rather than accepting current market conditions
Bend's increase in unsold listings is more pronounced than the national trend. Nationally, approximately 5.6% of listings were removed from the market in September, which was similar to last year. Bend's 65% increase therefore deserves close attention. Some of these properties may return to the market in 2027. If they do, they could create additional competition for next year's sellers.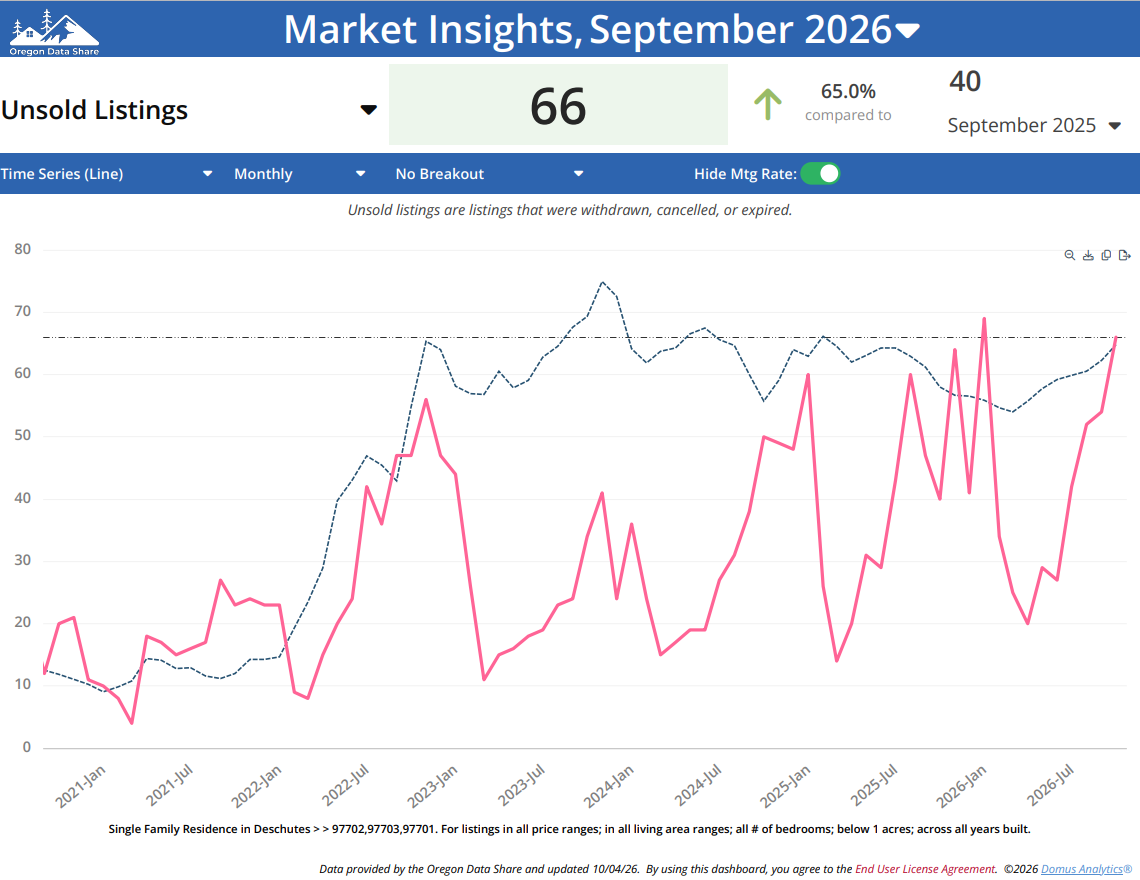
Price Reductions Are Becoming More Common
Price reductions are now appearing throughout the Bend market, and some are substantial. This is consistent with broader national and Western market conditions. According to the Realtor.com September 2026 Housing Trends Report, 20.8% of active listings nationwide had a price reduction—the highest September share since 2018. Price reductions were most common in the West, where 22.8% of listings had experienced a cut.
Portland had one of the highest price-reduction rates among major metropolitan areas, with approximately 31% of active listings carrying a reduced price. That reinforces that pricing pressure is not unique to Bend.
A price reduction does not automatically mean a property has lost that amount in market value. In many cases, the original asking price was higher than buyers were willing to pay. The reduction represents a correction of seller expectations rather than a sudden decline from a previously established market value. Nevertheless, repeated or substantial reductions indicate that sellers are competing for a smaller group of qualified buyers.
Few Traditional Resale Homes Are Selling Above List Price
Only 12% of September sales closed above the asking price, a decline of 24.6% from last year. Many of those above-list closings involved new construction in which buyers selected upgrades after entering into the purchase agreement. Those upgrades can cause the final recorded price to exceed the original base price. Consequently, the 12% figure should not be interpreted to mean that a significant share of typical resale homes received competitive offers above asking price. Multiple-offer situations still occur for exceptional homes, but they are no longer representative of the overall Bend market.
For most sellers, pricing above recent comparable sales in anticipation of a bidding war is not a sound strategy.
Seller Concessions Remain a Major Part of the Market
Seller concessions were included in 45.6% of September closings, up 14.2% from a year earlier. The average concession increased to $10,000. These concessions can help buyers pay closing costs, reduce the initial interest rate or permanently buy down the mortgage rate. At current borrowing costs, assistance with financing may be more valuable to a buyer than a comparable reduction in the purchase price. Find out what a seller-paid rate buydown versus a price reduction means for a Bend homebuyer.
For sellers, however, concessions reduce net proceeds. A property may appear to have sold near its asking price while the seller contributed $10,000 or more toward the buyer's transaction costs. The average sale received 95.2% of its original list price. When seller concessions are considered, the seller's effective net can be lower still. This is why sellers and their agents need to evaluate the entire transaction—not simply the recorded sales price.
Why Did List-to-Close Time Decline?
The average list-to-close period was 79 days, down 7.1% from last year. At first, this appears inconsistent with declining sales and rising unsold listings. The explanation is that list-to-close time includes only properties that successfully closed. It does not include the 66 withdrawn, canceled or expired listings that failed to sell.
The homes closing in the current market are generally those that were priced competitively, showed well or offered terms attractive enough to motivate a buyer. Overpriced homes that remained on the market and were eventually withdrawn are not reflected in the closed-sale timing statistic.
Therefore, the shorter list-to-close period should not be interpreted as evidence that the entire Bend market is moving faster.
Bend Has Fewer Listings but Buyers Still Have Leverage
Active inventory totaled 518 homes, down 16% from September 2025. Bend had approximately 3.3 months of inventory, essentially unchanged from last year. Those figures do not describe a traditional buyer's market with an excessive supply of homes. However, market leverage is determined by both supply and demand. When demand falls more quickly than effective supply, buyers can gain negotiating power even when the total number of listings is lower.
Buyers who remain qualified have several advantages:
-
More time to compare competing properties
-
Greater opportunity to negotiate price
-
Increased likelihood of receiving seller concessions
-
Less competition from other financed buyers
-
Greater leverage when a home has accumulated market time
The limitation is affordability. Buyers may have more negotiating power, but higher mortgage rates restrict how much of that opportunity they can use.
How Does Bend Compare With Oregon and the Nation?
Bend's September slowdown reflects a broader trend, particularly in Western housing markets. Across Oregon, the median sold price was approximately $510,000 in September, down 0.9% from a year earlier. Price per square foot declined approximately 1.2%, while active listings increased about 8%. Homes spent a median of 66 days on the market. Nationally, active inventory increased 5.4%, but the number of homes under contract declined 4.1%. The national median list price fell 1.4%, and price per square foot declined 1.7%.
Bend differs from much of the country because local active inventory remains below last year. Yet Bend's 21.2% decline in pending sales was considerably greater than the national decline in pending inventory. This suggests that Bend is not suffering from excessive supply. It is suffering from constrained demand in a relatively expensive market.
Is the Bend Housing Market in a Correction?
Bend is experiencing a correction in sales activity, buyer purchasing power and seller expectations. However, September's data do not establish a broad price collapse.
Evidence of a correction includes:
-
Closed sales down 16%
-
Pending sales down 21.2%
-
Sold price per square foot down 1.1%
-
Sales above list price down 24.6%
-
Unsold listings up 65%
-
Nearly 46% of closings including concessions
-
Frequent and sometimes substantial price reductions
Evidence against a crash includes:
-
Median sales price up 0.4%
-
Active inventory down 16%
-
Months of supply holding at 3.3
-
No indication of widespread distressed selling
-
Continued demand for correctly priced properties
The current adjustment is occurring primarily through fewer transactions, price reductions, concessions and unsuccessful listings. Median prices often respond more slowly because sellers who cannot obtain their desired price may withdraw rather than sell.
Correct Initial Pricing Is Critical
Sellers should not assume that they can begin with an ambitious price and reduce it later without consequences. The greatest buyer attention generally occurs when a property first enters the market. If buyers immediately conclude that a home is overpriced, the listing can lose momentum during its most important marketing period.
Substantial price reductions may eventually attract attention, but buyers can also interpret repeated reductions as evidence that the seller is becoming increasingly motivated. That can lead to more aggressive offers and requests for concessions.
A successful pricing strategy should consider:
-
Recent comparable sales
-
Current competing listings
-
Pending and failed listings
-
Price reductions within the immediate market segment
-
Property condition and updates
-
Location and lot characteristics
-
Likely buyer financing
-
Current mortgage rates
-
Competing new construction incentives
A seller's desired proceeds do not establish market value. Neither does a neighbor's original asking price. The correct price is the one supported by current buyer behavior.
What September Means for Bend Buyers and Sellers
For buyers, September created more negotiating opportunity—but not necessarily better affordability. Price reductions and seller concessions may help, especially when concessions are used strategically to reduce borrowing costs.
For sellers, the September figures are a direct warning against overpricing. Homes are still selling, and Bend continues to have less active inventory than last year. But buyers are scarce enough that sellers must compete for their attention.
The market is separating properly positioned homes from those whose price, condition or terms do not meet current buyer expectations. Sellers who recognize that early have a much better chance of closing. Those who wait for the market to validate an unrealistic price may become part of the growing unsold-listing total.
Frequently Asked Questions About the Bend Housing Market
What was the median home price in Bend in September 2026?
The median sales price for Bend single-family homes on less than one acre was $726,250, up 0.4% from September 2025.
Are Bend home prices falling?
The September median sales price was nearly unchanged, but sold price per square foot declined 1.1%. Prices are not falling uniformly, although frequent price reductions show that many sellers are adjusting expectations.
Why did Bend pending sales fall so sharply?
Pending sales declined 21.2% as higher mortgage rates reduced buyer purchasing power. Rates rose from 6.71% to 7.03% during September and climbed further in early October.
What is an unsold listing?
For this report, an unsold listing is one that was withdrawn, canceled or expired and had not been relisted. Bend had 66 such listings in September, up 65% from the previous year.
Is Bend a buyer's market?
With 3.3 months of inventory, Bend is not a traditional buyer's market. However, weaker demand, frequent price reductions and seller concessions are giving qualified buyers meaningful negotiating leverage.
Is the Bend housing market crashing?
No. Active inventory remains below last year, the median sales price was stable, and there is no evidence of widespread distressed selling. Bend is experiencing a correction in sales activity and seller expectations rather than a housing crash.
How common are seller concessions in Bend?
Seller concessions were included in 45.6% of September closings. The average concession amount was $10,000.
Why are some Bend homes still selling above list price?
Some above-list sales involve new construction where buyer-selected upgrades increase the final price above the original base price. This does not necessarily indicate competitive bidding on the property.
What is the most important advice for Bend sellers right now?
Price the home correctly when it first enters the market. Buyers are comparing listings carefully, and overpriced homes face longer exposure, substantial reductions or the possibility of leaving the market without selling.
Track the Bend market: See our continuously updated Bend Oregon housing market statistics and analysis.
Privacy Policy / DMCA Notice / ADA Accessibility


